Indexed Is Not Served: A Month of Flat Zero With Every Metric Green
In this article
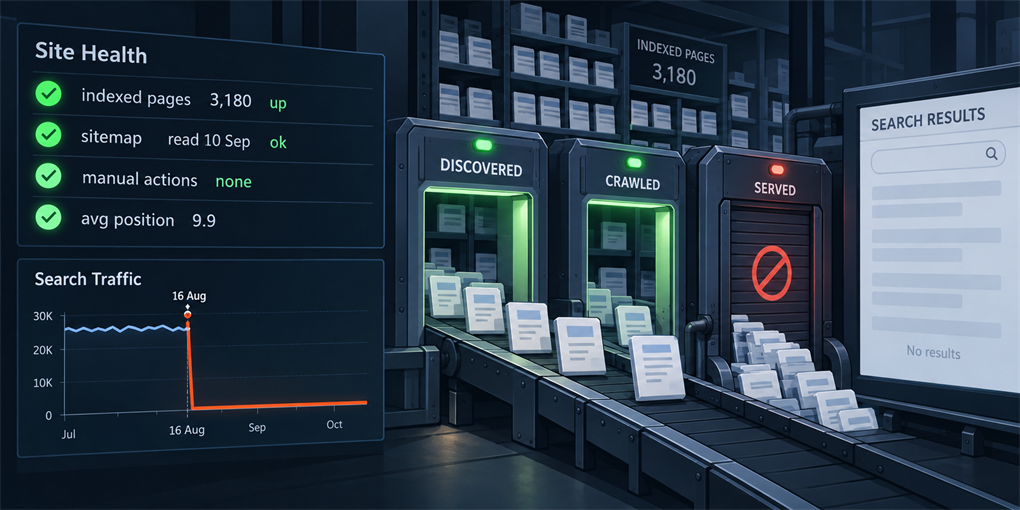
On 15 August VitaminD Explorer served 879 impressions in Google Search. On 16 August it served 35. It has not recovered since: a month later it runs between 8 and 40 impressions a day, with essentially zero clicks.
It is a solar vitamin D calculator: given a real location and a real skin type, it works out whether the sun outside can synthesise vitamin D at all right now, how many minutes it would take, and which months of the year it is possible at that latitude. That question has a different answer in every city and every month, which is why the site carries a few thousand pages — and why it is a useful specimen for this post-mortem.
Every health indicator I had was green throughout. No manual action. No deindexing — the index count went up, from 3,170 pages to 3,180. Sitemap submitted, read, accepted: 3,636 URLs, last fetched three days before I looked. Googlebot still crawling, no host errors. Average position 9.9, which is where it had always been.
This is the post-mortem of a diagnosis, not of a fix. I still do not know the cause. What I do have is a set of measurements that killed several comfortable explanations, and one distinction I did not have before: being indexed, being crawled, and being served are three different currencies, and you can be rich in the first while bankrupt in the third.
The aggregate hid it for thirteen days
The first mistake was not analytical, it was ergonomic. Every report I looked at was a 28-day or 90-day total. “119 clicks in three months” reads like a small site slowly growing.
Opening the daily series showed something else entirely: those 119 clicks are almost all concentrated between 21 July and 14 August, with days peaking at 15. After that the line is flat on the floor. Thirteen days had passed before anyone looked at the shape of the series rather than its sum.
An aggregate cannot tell a rising trend from a dead one that used to be rising. That sounds obvious written down. It is not obvious when the dashboard’s default view is a total and you are busy.
What the cliff looks like up close
| Day | Impressions | Clicks |
|---|---|---|
| 14 Aug | 1,427 | 5 |
| 15 Aug | 879 | 3 |
| 16 Aug | 35 | 1 |
| 17 Aug – 10 Sep | 8–40 per day | ~0 |
A single day, −96%, permanent. That shape matters: a seasonal decline slopes, a technical breakage usually shows up in error reports, and an algorithmic reclassification flips.
The explanations that died on the next check
In one afternoon I produced three confident causes. All three were falsified, two of them by me, within hours:
- “It’s the antispam update.” Google’s ran from 18 August. The cliff is the 16th. Two days before, not after.
- “It’s the title change I deployed on the 15th at 22:06.” URL inspection said Google had last crawled those pages on 26 July and 3 August. It had not seen the change at all. I had asserted a cause for a deploy the crawler never fetched.
- “It’s seasonal, August queries dying.” September pages were already accumulating impressions before the cut, and the collapse is identical across three languages whose seasonal patterns are not identical.
The discipline that survives this is worth more than any of the three hypotheses: do not produce a fourth explanation just because the third one died. An unexplained collapse is an acceptable state. A wrong explanation you have started acting on is not.
The measurement that reframed it
Comparing 17 Aug – 10 Sep against the equivalent window before the cut, split by URL family — each family being the same template in a different language, e.g. sunrise and sunset in Madrid in September:
| Family | Impressions before | After | Position |
|---|---|---|---|
/sunrise/ (en) | 14,300 | 347 | 9.0 → 21.6 |
/amanecer/ (es) | 15,400 | 111 | 12.0 → 13.8 |
/sonnenaufgang/ (de) | 4,850 | 43 | 8.4 → 11.3 |
| Whole site | 36,900 | 488 | 9.4 → 20.2 |
Look at the two columns together. Impressions fall by 98.7%. Position falls by between 2 and 12 places. Those are not the same event.
If a site slid down the rankings, impressions would decay roughly in proportion to the positions lost — you keep appearing, lower. Here the site keeps roughly its position where it still appears, and stops appearing at all almost everywhere. The number of distinct queries returning it went from four figures to 159 in 28 days.
That is not a ranking problem. It is an eligibility problem: the site stopped entering the candidate set for the long tail. And I would not have seen the difference from the headline “average position”, which mixes both into one number.
Three currencies, not one
Fifteen days after the cliff I published a small set of new pages: a hub answering how long in the sun you need for vitamin D, with a variant per skin type, in six languages. Two weeks later I checked them one by one, and the states are worth quoting exactly:
- Spanish hub: indexed, the day after publishing.
- German: “Crawled – currently not indexed” — fetched, evaluated, rejected.
- Russian: “Discovered – currently not indexed” — known, never fetched.
- English, French, Lithuanian: “URL is unknown to Google” — not even discovered.
All six are in the same sitemap. The sitemap was read, successfully, three days before I ran these checks. Google had the list and was not going to go and get them.
Then I requested indexing by hand. The Russian page went from “discovered, never crawled” to “URL is on Google” in minutes.
That is the whole lesson in one experiment. The content was not being rejected — when asked, Google fetched and indexed it immediately. What was missing was crawl demand: the appetite to go and look. Three separate things, which the word “indexed” collapses into one:
- Discovered — Google has the URL.
- Crawled — Google spent a request on it.
- Served — Google puts it in front of someone.
A dashboard that reports 3,180 indexed pages is telling you about currency 1 and 2. It says nothing about 3, which is the only one that has users in it.
The number that invalidates the usual advice
While I was in there, one more thing, measured across 33,000 impressions and 1,000 pages before the collapse:
| Band | Pages | Impressions | Clicks | CTR |
|---|---|---|---|---|
| Positions 6–10 | 637 | 22,852 | 68 | 0.30% |
| Positions 11–20 | 253 | 10,273 | 32 | 0.31% |
Moving from page two to page one bought nothing. Not “less than expected” — nothing, to two decimal places, on a sample big enough to see it. The expected CTR in positions 6–10 is a few percent; this is an order of magnitude below.
Every piece of SEO advice I could act on is denominated in positions. On this site, in this SERP shape, position is not convertible into clicks at all. Which means the honest answer to “how do we get more traffic” was never “rank better”, and a year of work aimed at ranking would have returned zero — measurably, before doing it.
What I would take from this
- Look at the shape of the series before the total. An aggregate cannot distinguish “growing” from “dead, was growing”. Open the daily chart first, every time.
- Separate rank from eligibility. If impressions fall far faster than position, you are not being outranked, you are not being considered. Those have different causes and different fixes.
- Do not let “indexed” stand in for “served”. Check discovered, crawled and served as three separate states. The failure can sit in any of them, and the index count will look fine in all three cases.
- Test whether your currency converts. Before optimising a metric, measure what a unit of it is worth. Mine was worth zero, and one table showed it.
I am going back to the cause with a clearer question than the one I started with. Not “why did the traffic fall” — “why did this domain stop being considered”. I do not have the answer yet, and I would rather say that than supply a fourth story.
Meanwhile the thing still works, which is the part search never measured: getvitamind.app answers the sun question for your own location and skin type, with no account and no app to install, and there is an MCP server if you would rather ask your assistant.