Which Sport Is It? Recognising a Sport Only From How the Players Move
In this article
When we watch sport, there is something we do without thinking: we recognise what we are watching before we can explain why. I noticed it while watching a video where you could barely make out the pitch. Even so, I knew straight away it was rugby and not football. What gave it away was not the setting but how the players moved.
I was left wondering whether that can be isolated. If I remove everything else (the pitch, the ball, the colours, the kits) and turn the players into dots, is the sport still there? And does a model see it?
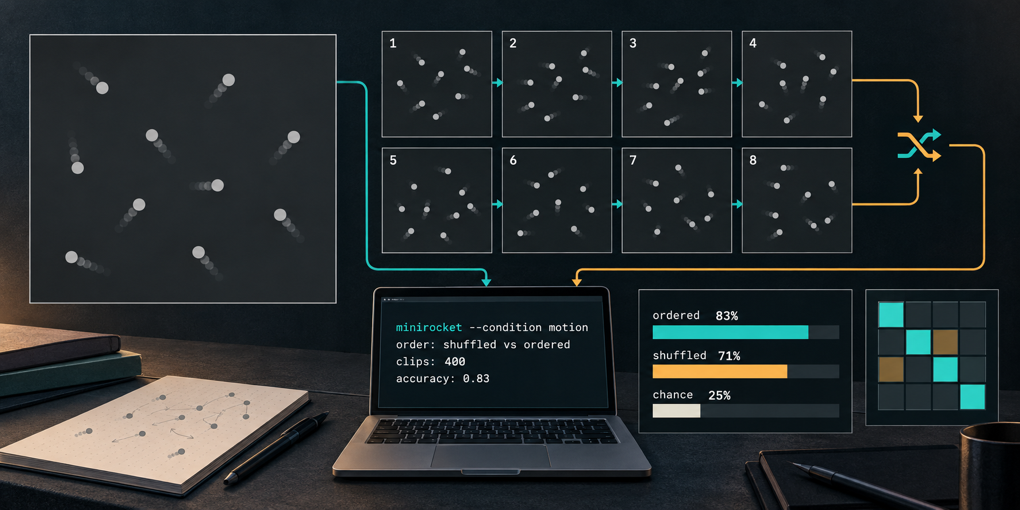
To test it I prepared images like this one, which is exactly what the models received:
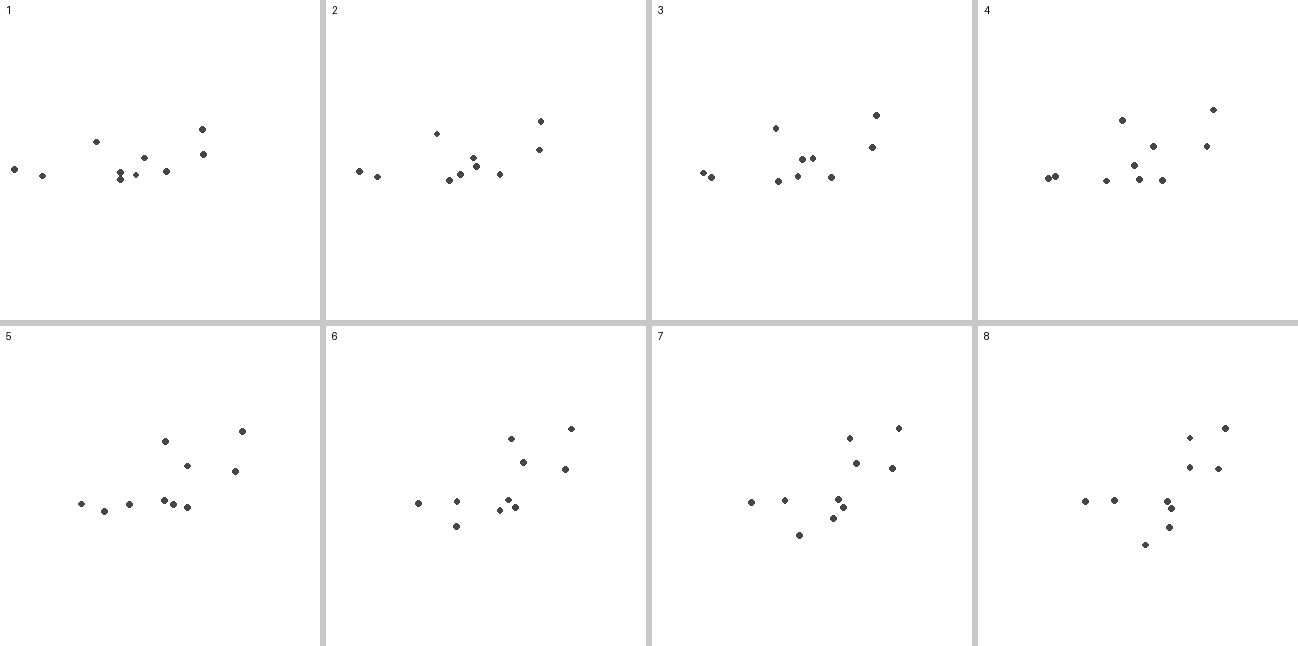
Eight snapshots of a play, about 0.5 seconds apart. Ten grey dots, one per player, seen from above. Nothing else: no pitch, no ball, no colours, no scale. Which sport is it? I’ll give the answer at the end, along with what the models said.
The question is a sibling of Where’s the Ball?, where I hid the ball and asked models to find it by looking at the players. Here I hide everything except the players and ask about the whole game: is movement enough to recognise a sport?
Moving dots
The representation comes from a classic perception experiment: Johansson’s (1973) point-light displays, in which a person filmed in the dark with a few lights on their joints is instantly recognised as someone walking or dancing. Here each dot is a whole player, and what has to be recognised is the sport.
I used real tracking data from four sports:
- American football: NFL Big Data Bowl 2023.
- Basketball: NBA SportVU 2015-16, 31 games.
- Handball: EIGD-H (German Bundesliga, Kinexon sensors) and TeamTrack.
- Soccer: SkillCorner, Metrica and TeamTrack.
Rugby, the original question, is left out: there is no public rugby tracking data good enough to do this properly.
Each clip is 4 seconds of 10 randomly chosen players (the number of players would give the sport away), randomly rotated and rescaled so that the size of the pitch says nothing either. The models got 400 clips, 100 per sport, from 151 different games.
The interesting part is not only whether they get it right, but which part of the signal they use. So each clip is shown under several conditions, always the same clips:
First, check that the signal exists
Before asking anyone, I needed to know whether the question has an answer. I trained two small specialists, with cross-validation grouped by game so they could not recognise the game instead of the sport: MiniRocket, which is essentially thousands of random filters plus a regression, and a DeepSets network over each player’s trajectory. Minutes of CPU on a laptop.
On the same 400 clips the models would see, MiniRocket is right 83% of the time and DeepSets 80%, against a 25% chance level. And motion is what counts: shuffle the snapshots and MiniRocket loses 12 points; give DeepSets a single snapshot and it drops to 54%. The information is in how the players move, and a very small model finds it.
It is the same pattern as in Part 2 of Where’s the Ball?: the signal is there, and the interesting question is who can see it.
The hard part was removing the shortcuts
That 83% did not come out on the first try, and most of the work in the experiment went into making sure it was not lying. A trained classifier learns anything that separates the classes, and tracking data has plenty of things that separate sports without being the sport:
- The number of players. Basketball has 10, soccer 22. So every clip has exactly 10, chosen at random.
- The size of the pitch. So everything is rescaled. And keeping the 10 most central players turned out to be a shortcut too: in soccer and handball that compact group looks like a basketball court. With 10 random players, the specialists gain 7 points.
- The capture system. This was the most instructive one.
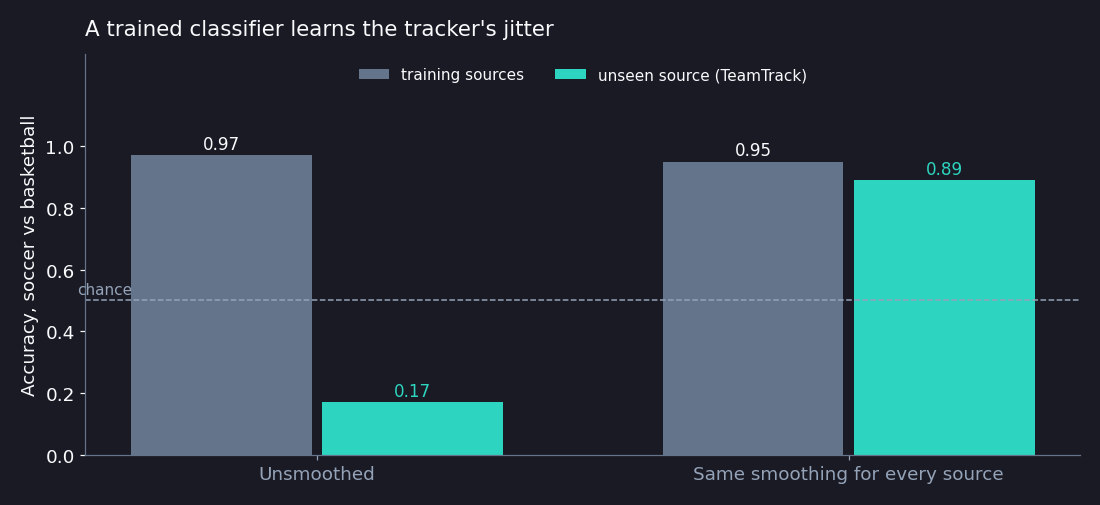
TeamTrack films with a fisheye camera, and on a large soccer pitch its positions jitter: about seven times the acceleration of the same sport measured by other systems. A classifier that has not seen TeamTrack reads that jitter as basketball’s stop-and-go and labels almost all of its soccer as basketball. Smoothing every source the same way fixes it, and on the final set it reaches 95% on the unseen source.
There were more, all of the same kind:
- NFL plays started just before the snap, so every clip was “still, then everyone at once”. Now each clip starts at a random moment of the play, at least one second after the snap.
- TeamTrack marks undetected players with the coordinate (0, 0), which, unfiltered, shows up as a motionless dot in a corner.
- SportVU sometimes records the same player under two IDs, so the model saw 9 dots instead of 10.
- The two halves of the same handball game counted as different games in the validation.
None of these shortcuts is exotic. They are what happens when you mix data from six sources with different capture systems, and none of them shows up if you only look at the final number.
The frontier models
With clean data, I prepared a run with five frontier models: GPT-5.6 Sol, GPT-5.6 Terra, Claude Opus 5.5, Claude Sonnet 5 and Gemini 3.1 Pro. I also added Jev, a typed-decision model that only reads text and returns a probability per option directly. Before seeing a single answer I wrote down a pre-registration: the hypotheses, the four primary contrasts per model, the correction for multiple comparisons, and the exact rule for saying that a model “reads motion”. With 20 contrasts and data like this, it is very easy to find something without rules fixed in advance.
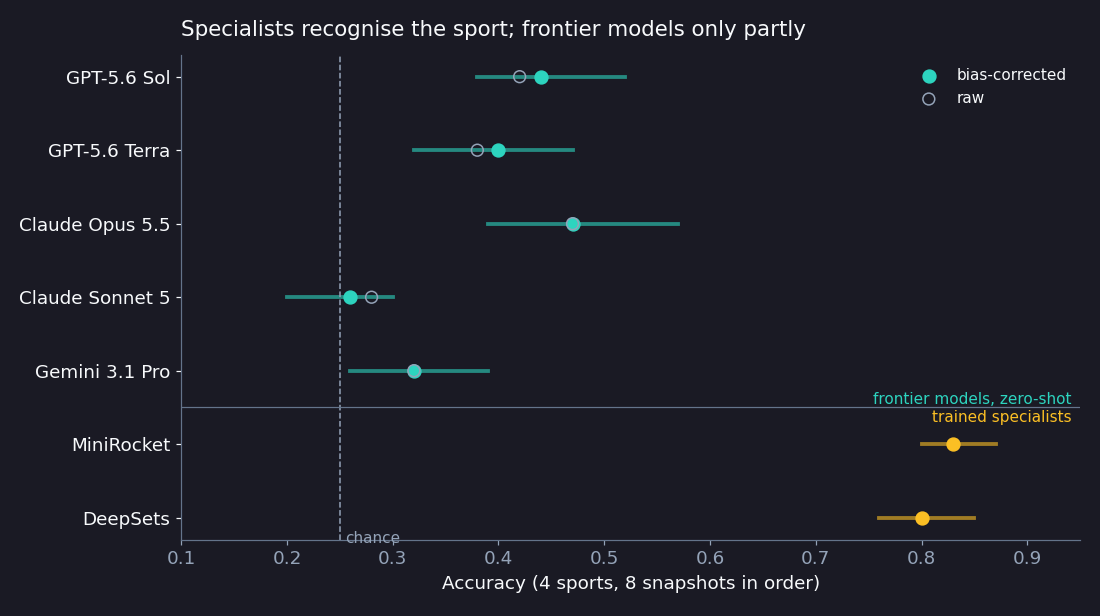
The first thing that stands out is that the models have a favourite sport they fall back on when unsure. GPT-5.6 Sol answers American football on 62% of clips, Gemini on 66%, and Sonnet answers soccer on 64%. That inflates accuracy on the favourite and sinks it on the rest, so besides raw accuracy I computed a version corrected for that bias, always estimated on games other than the clip’s own. With the correction, Sol, Terra, Opus and Gemini sit above chance. Sonnet 5 does not.
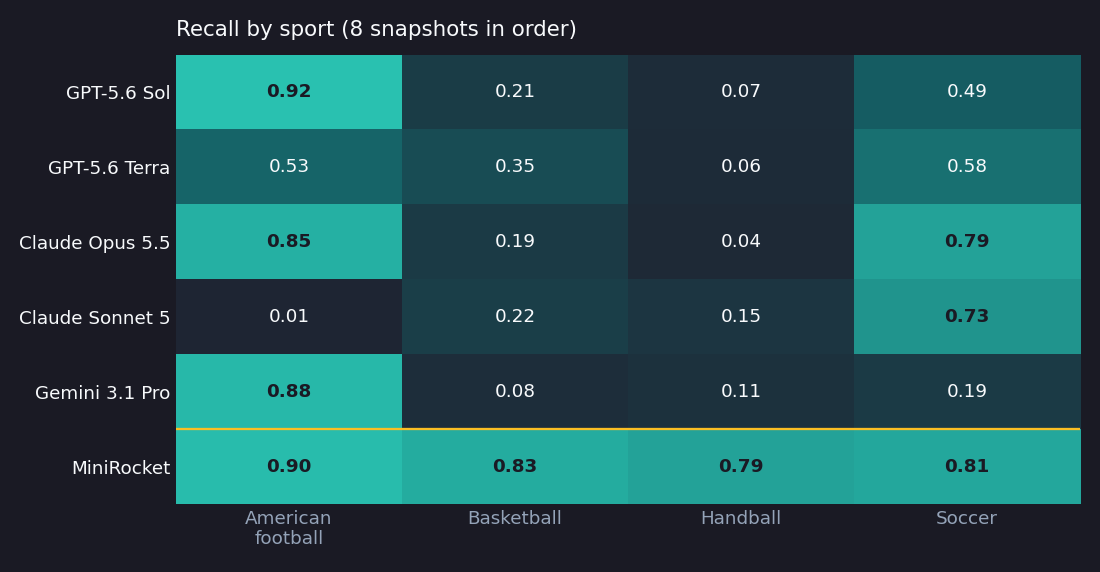
Does the order matter?
The question that decides whether a model sees motion is the one from the conditions figure: is it less accurate when the snapshots are shuffled?
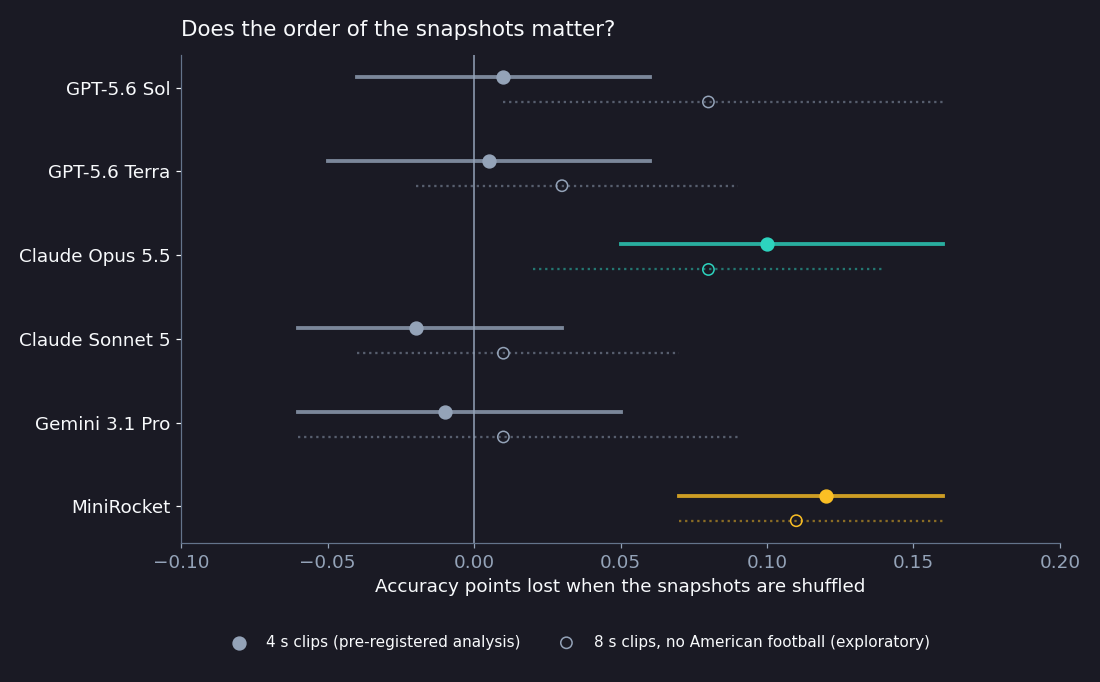
Under the rule fixed in advance, Claude Opus 5.5 is the only one of the five that reads temporal order: shuffling the snapshots costs it 10 points, with an interval from 5 to 16, almost as much as MiniRocket. It holds up across replicates and, as an exploratory check, with 8-second clips.
Some nuances matter:
- Opus’s effect is concentrated in American football and basketball, and is null in handball and soccer. In American football part of the signal may be the acceleration at the start of the play, which is still there even though the clips start after the snap. The 8-second test has no American football and the effect is still there (+0.08), which suggests it is not only that.
- For the other four there is no evidence, which is not the same as evidence that they don’t read it. From the intervals, order adds at most 3 to 6 points for them. And there are exploratory hints: GPT-5.6 Sol loses 8 points with 8-second clips, and Sol and Gemini read order within American football, offset in the total by other sports.
- They get something from shapes. Sol, Terra and Gemini are above chance even with the snapshots shuffled, and Sol even with a single snapshot. They see something in how the players are arranged, but there is no evidence that how that arrangement changes helps them.
What didn’t help
I also tried three things that looked promising, and none of them moved the results clearly:
- Coordinates as text instead of images. Neither consistently worse nor better. Gemini does somewhat better with text, without reaching significance. Jev, which can only read text, stays at chance: it answers “soccer” on 90-100% of clips. Its probabilities seem to move a little with the order (bias-corrected, 0.34 with the snapshots in order against 0.21-0.23 shuffled), but they almost never change its answer, and it is not a difference I tested.
- Telling it what to look for. A prompt that describes how each sport moves, without numbers, raises accuracy by 0 to 3 points. Nothing that survives the correction.
- Trails and video. Drawing each player’s trail helps no one, and costs Sol 7 points. With video, Gemini is about 7 points better than with the sheet, but it is exploratory and not enough to claim.
What I take away
The information needed to recognise a sport is in the players’ movement, and a classifier that fits on a laptop extracts it 83% of the time. Frontier models, on this task and with these representations, land between chance and 47%, and only one of the five shows that it uses the order of the snapshots.
I don’t conclude from this that the others “don’t see movement”: I conclude that there is no evidence they use it, and that if they do, it is not much. Nor that Opus reads movement in general: it does so mostly in two sports. What does seem robust to me is the gap with the specialists, and how much it took to reach a number worth trusting. Every shortcut I removed would have told a different story.
And the sheet at the top is basketball. Three models answered American football (ten dots almost in a line look like a line of scrimmage) and two answered soccer. All three specialists, MiniRocket, DeepSets and the movement-statistics classifier, got it right.
Code, pre-registration and full results at github.com/JaviMaligno/sport-from-motion. The analysis follows the pre-registration, and the results include everything that did not work out. The data is not redistributed; each source has its own licence.