You Already Have an Ontology
In this article
A diagram has been going around, titled “Technical Semantic Architecture for AI Agents.” Here it is, redrawn:
My first reaction was the one I suspect most people who ship agents have. I’ve built agents that research, that fill forms in real browsers, that review code, that classify compliance risk — and not one of them needed a knowledge graph. A coding agent is a model plus a filesystem, grep, a terminal and git. A support agent is a model plus a vector store and two APIs. The diagram looked like sophistication in search of a problem.
I still mostly think that, but I was reading it wrong. The diagram presents itself as an architecture you adopt. It’s far more useful as a diagnosis of something you already have — and to test that, I ran the audit on my own code. The result was worse than I expected, which is what makes it worth writing about.
The four boxes, quickly
The distinction that carries the whole diagram is ontology versus knowledge graph: what kinds of things can exist, versus what happens to exist right now.
If you come from databases, the mapping is almost exact: ontology is the schema, entity types are tables, properties are columns, relations are foreign keys, and the knowledge graph is the rows. In philosophy, ontology asks what categories of things there are and how they can relate — the software version is the same question with the ambitions lowered from reality to our system.
The two side boxes are inputs. A taxonomy is just an is-a hierarchy: BackendEngineer is an Engineer is an Employee. Classification, nothing more. A semantic layer is the analytics idea: the one canonical definition of ARR, churn, active customer, so the agent doesn’t invent its own arithmetic.
Context graph is the box I like best, and the one with the weakest pedigree — it isn’t standard terminology, and you won’t find it in a textbook. It’s still the right name for something we all do without naming it. Your knowledge graph might hold ten million entities; your context window holds a few hundred thousand tokens. So for each decision you assemble a small, decision-specific slice — this customer, its blocked project, the review holding it up, the person who owns that review, the fact that they’re on holiday until the 7th. That subgraph is what the model actually sees. Naming it makes it something you design deliberately rather than whatever your retriever happened to return.
One piece of context the diagram doesn’t give you: this shape has a provenance. It’s Palantir’s ontology pitch crossed with the analytics semantic layer (dbt, Cube, AtScale). That’s not a criticism — it’s a hint about the intended customer. This is an architecture for organisations with many systems, many teams, and definitions genuinely in dispute. Reading it as “the architecture for AI agents” is a category error the title actively encourages.
The ontology you already wrote
Here’s the claim I want to test: you don’t get to decide whether you have an ontology. You only get to decide whether it lives in one place. In most systems it’s already there, smeared across the database schema, the API types, the enums, the ORM models, the docs and the prompts. The diagram’s real proposal isn’t “add a layer.” It’s “you have one; consolidate it.”
To see whether that holds up outside a slide, I audited a project of my own: a job-application automation tool, Python API plus a Next.js dashboard. It’s a personal project, single author, no committees and no legacy — which makes it the weakest possible case for the argument, and that’s exactly why it’s interesting.
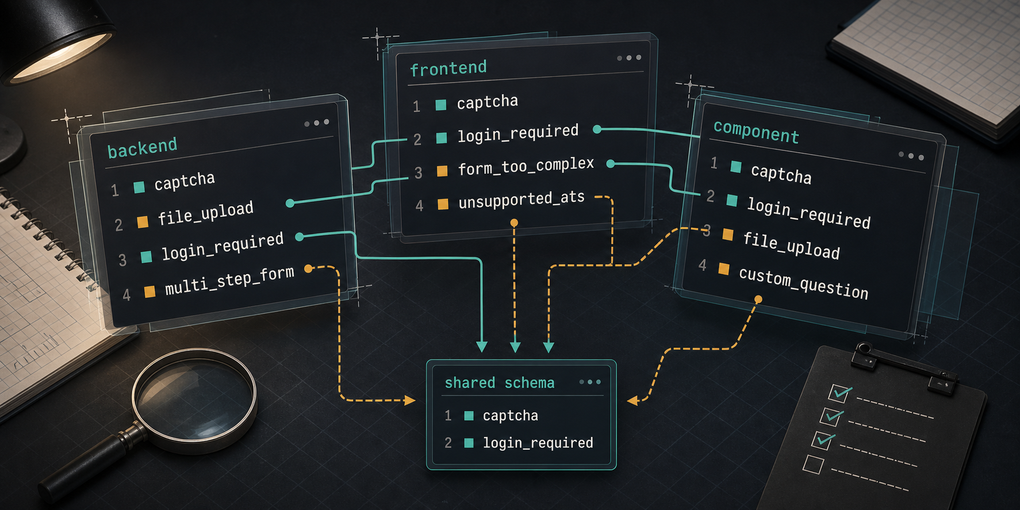
Its central entity is the blocker: the thing that stops an application from being submitted automatically. A CAPTCHA, a login wall, a multi-step form. The entire product exists to detect blockers and hand them to a human. If anything in that codebase is well-defined, it should be this.
It’s defined in three places — a SQLAlchemy enum in the backend, a TypeScript enum in the frontend, and a Record of labels inside a React component — and they don’t match:
The frontend believes in form_too_complex and unsupported_ats, which the backend cannot produce. The component renders custom_question and review_before_submit, which exist in no enum anywhere. And file_upload sits in the database model, dutifully migrated, while the detector that’s supposed to emit it never does.
The status vocabulary is the same story. ApplicationStatus has seven values in Python and five in TypeScript. The two missing ones are cancelled and — this is the one that stings — needs_intervention, the status whose entire purpose is to say a human is needed here. The backend emits it in three separate places. The dashboard handles it as a bare string literal in a switch, because its own enum doesn’t have it.
Nobody decided not to model this domain. It got modelled four times, on four different days, and drifted. That’s the point. If a single developer working alone on a small codebase produces four incompatible definitions of the concept the product is named after, then scattered ontology isn’t an organisational-scale problem you avoid by staying small and disciplined. It’s structural.
Why it drifts, and why no compiler stops it
The mechanism is dull and worth stating plainly. A domain concept has to cross two boundaries that no tool guards.
It crosses a language boundary: Python to JSON to TypeScript. Types are checked on each side of that wire and nowhere across it. A blocker_type of "location_mismatch" deserialises into a variable typed JobBlockerType without complaint, because at runtime a TypeScript enum is just a string. The value is invalid; the type system is looking elsewhere.
And it crosses a time boundary. The backend enum was extended when the detector learned a new failure mode. The frontend enum was written earlier and had no reason to change — nothing broke. Drift doesn’t announce itself; the UI just quietly renders a grey fallback badge and everyone moves on.
This is exactly the problem the analytics world solved first, which is why the semantic layer became a product category at all. dbt’s own pitch for it is that five people can run what they think is the same report and get five different numbers, because different teams wrote different SQL for “revenue.” Same failure, one abstraction level up. My eleven blocker values are that problem in miniature — and I had the advantage of being the only person in the room.
Agents raise the stakes on this
Here’s why an old problem is suddenly worth re-examining.
When a UI meets a value it doesn’t know, it degrades visibly. A grey badge, a missing icon, an empty column. A human sees the gap and works around it.
When an agent meets a value it doesn’t know, it doesn’t degrade — it interprets. It has to produce a decision, so it reaches for the only model of the world it has: the implicit, probabilistic ontology baked into its weights. It has read enough software to have opinions about what location_mismatch probably means and how serious it probably is. Those opinions are plausible, unlogged, and not your company’s.
That’s the real argument for making the ontology explicit, and it’s narrower than the diagram implies. It isn’t that a knowledge graph makes the model smarter. It’s that it moves knowledge from “statistically likely” to “defined by this system”, so that when the agent is uncertain it consults something authoritative instead of confabulating something reasonable.
The four boxes come apart
Before asking whether you need the architecture, it’s worth noticing that you almost never need all of it. The diagram draws four boxes as one stack, but they’re independently adoptable, and most systems need exactly one of them. Take the agents I’ve actually built:
- A coding agent asking where is this function defined, and who calls it? That’s a graph — call edges, imports, definitions. But
grep, an LSP server and a test runner already traverse it, and the index is maintained by tooling nobody thinks of as a knowledge graph. The relations are real and the box is unnecessary, because the traversal already ships with the language. - A support agent asking what’s the refund policy for this plan? Text similarity is exactly the right retrieval primitive. Nothing chains. This is the vector-store case, and adding a graph would be strictly worse.
- A compliance classifier asking which risk category does this system fall into? Here one box earns its place, and it’s the smallest: a taxonomy. The whole job is placing an instance into a hierarchy of categories with defensible boundaries. No instance graph required — the value is in the classification being explicit, versioned, and the same one the auditor reads.
- A reporting agent asking how much ARR renewed this quarter? The box that matters is the semantic layer, and only that one. The failure mode isn’t a missing relation, it’s four teams with four definitions of ARR.
So “do I need this architecture?” is the wrong question. The better one is which of these four failure modes do I actually have — unstable classification, disputed definitions, unbounded relations, or a context window that can’t hold the answer. They have different fixes and different prices.
The criterion: the shape of the question, not the size of the data
For the knowledge graph specifically, the wrong test is volume. Plenty of teams with enormous datasets need nothing but Postgres and good types.
The test I’d use is the shape of your queries:
Which invoices are overdue this week? How many tickets did this customer open last month? Which Pro-plan accounts haven’t logged in for thirty days? Every one of those is a table, a filter, and a couple of joins you already know when you sit down to write the query. That’s the left-hand shape, and there a typed API over a relational database wins on every axis.
Why is this customer blocked? What breaks if we retire this endpoint? Who approved the version currently in production? Nobody can say up front how many hops those take — that depends on the answer. That’s the right-hand shape: traversals of unknown depth over dependencies, ownership, provenance, causality, permissions. It’s the one thing SQL is genuinely bad at, because every join has to be written before you know how many you need.
The practical tell is that simple: if you can’t write the query without already knowing the answer, your question is graph-shaped. Count how many of the questions your agent actually receives fail that test. If it’s a handful out of hundreds, you have a reporting tool with an interesting edge case, not a graph problem.
The evidence backs the conservative read. GraphRAG-Bench, an ICLR 2026 benchmark built to answer exactly this question, opens by noting that “GraphRAG frequently underperforms vanilla RAG on many real-world tasks,” and sets out to identify the conditions under which the graph actually wins — separating fact retrieval from complex reasoning and summarization, because they behave differently. Cost tells the same story: Microsoft’s own LazyGraphRAG exists because full GraphRAG’s up-front indexing was prohibitive, and its headline result is matching quality at 0.1% of the indexing cost. When the vendor’s follow-up product is mostly a way to avoid paying for the first one, take the hint.
There’s a ladder here, and the diagram skips straight to the top of it:
- One shared definition of your domain vocabulary, generated from a single source rather than hand-copied per language. Cheap. Fixes what my audit found.
- A typed API over the relational data, exposed to the agent as tools rather than raw SQL. This is where most agents should stop.
- A graph, when the traversals genuinely are unbounded.
Most of the value in that diagram is available at step one. Knowing when not to climb further is part of the discipline, the same way knowing when not to route is.
What the diagram hides
Look at the first figure again: it’s all boxes and arrows, and not one of those arrows is labelled and who keeps this true.
Modelling is the fun part. The part that kills these projects is population and freshness: ingestion, entity resolution (is Acme Corp in the CRM the same node as ACME Ltd. in the invoicing system?), and the question of who guarantees that Task 381 blocked_by SecurityReview is still a fact tomorrow. A knowledge graph is a materialised, denormalised view of half a dozen systems, and materialised views go stale.
Stale is worse than absent, and specifically worse for agents. When I measured how agents handle what has already happened — 572 responses across six models — the finding was that they plan around events that never occurred and invent dependencies between things that don’t depend on each other, and that giving them the date changes nothing. A calendar tells a model where now sits; it says nothing about which of its facts are already fixed and which relations still hold. A knowledge graph hands an agent exactly that kind of information: relations stated flatly, in the present tense, with no indication of when each one was last true. Every edge is well-formed, every type checks, the schema validates, and the content is three weeks behind reality — and unlike a raw document, the graph is the authoritative source, so the agent has no reason to hedge.
The one intervention that did help in that experiment was making provenance inseparable from the value, so a fact can’t travel without its caveat. Translated to a graph, that’s a design requirement the diagram never mentions: freshness and source belong on the edge, not in a sync job’s logs.
Where I’d actually start
Not with a graph database. With the audit.
Pick the entity your product is named after. Grep for every place its vocabulary is defined — the enum, the type, the constant map, the string literal in a switch, the sentence in the prompt that explains the domain to the model. Count the definitions. Count the values they agree on.
If you get one definition, you have an ontology and it’s centralised; the diagram has nothing to sell you until your queries turn graph-shaped. If you get four, like I did, then you already have an ontology — it’s just distributed across your codebase in a form no tool can check, and about to be handed to something that will confidently interpret whatever it doesn’t recognise.
That’s the useful reading of the diagram. Not an architecture to adopt. A question to run against the code you already have.
Related: Bring Your App to the Agent on exposing your system to agents as tools, and Your Agent Doesn’t Know What Has Already Happened on why a date doesn’t fix stale facts.