Where's the Ball? Part 2 — a 60-Kilobyte Model, Two Sports, and the Signal VLMs Miss
In this article
Part 1 ended on a sober note. Frontier vision-language models have a faint spectator’s intuition — their guesses about a hidden football correlate with where it really is — but on the cases that matter, balls genuinely far from the center of the frame, none of them reliably beat the dumbest possible strategy: point at the middle and trust the camera operator.
That left an uncomfortable question hanging. Maybe the hard cases are just hard — maybe the players’ positions don’t contain enough information to find an off-center ball, and I’d been asking the models to do the impossible.
So I tested that directly. The answer is no: the information is there, and a model small enough to email can extract it.
David, meet Goliath
The question has two axes, so I crossed them. One axis is who reads: a tiny specialist trained for exactly this, or a frontier generalist. The other is what gets read: the broadcast pixels, or the player tracks underneath them.
On the trained side, two specialists. For the tracks: a DeepSets network — a permutation-invariant architecture that eats an unordered set of players and pools them into one guess — trained on each player’s position and velocity over one second, nothing else. No pixels, no grass, no bodies. About 14,000 parameters, roughly 60 kB of weights, a few minutes of CPU on my laptop. For the pixels: a small off-the-shelf vision network (a ResNet-18) fine-tuned on seven thousand broadcast frames with the ball erased by inpainting — so it can’t detect the ball, only infer it. And the frontier models ran twice on the same paired items: once on the pixels (Part 1’s setup), and once on the exact same one-second tracks the tiny net saw, serialized as plain-text coordinates — same information, no pixels.
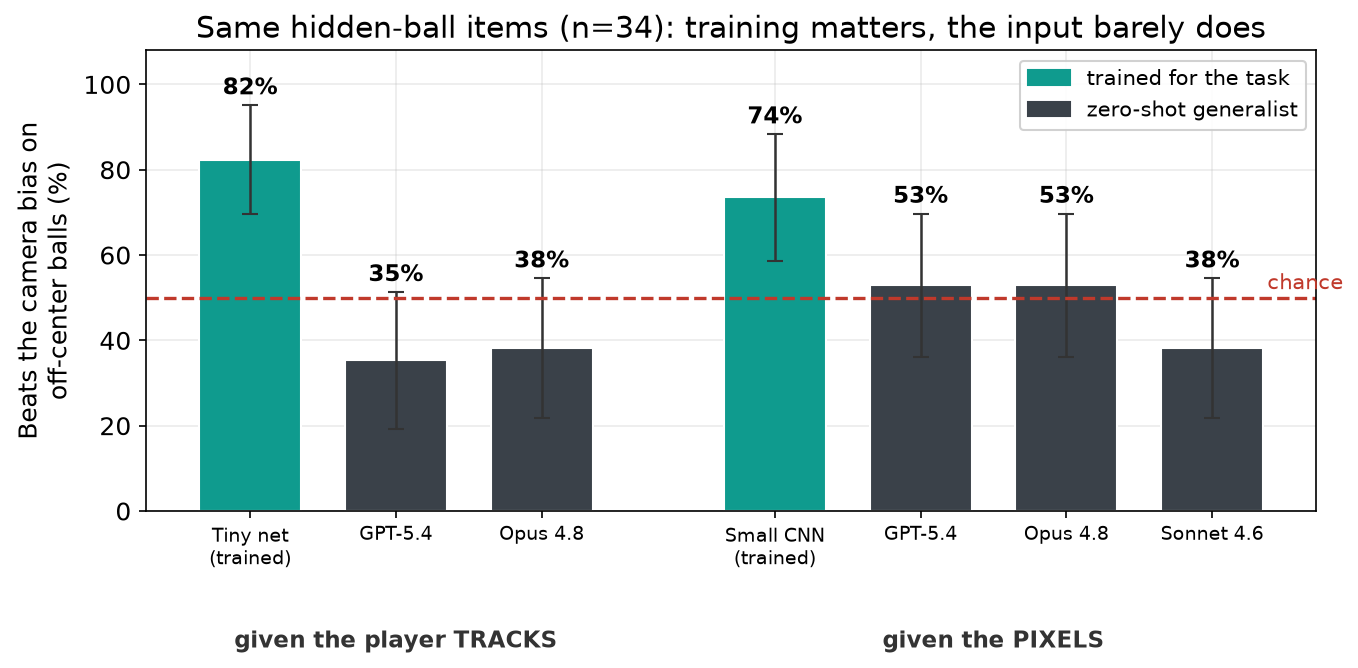
The pattern is hard to miss. The two trained models beat the camera bias on off-center balls — 82% from the tracks, 74% from the pixels. The frontier models don’t, from either input: 53% on pixels (statistically a coin flip), and 35–38% — below chance — on the tracks themselves, where their correlation with the true ball goes from weakly positive to null or slightly negative: handed raw coordinates, they drift into the very centroid trap that broadcast geometry punishes (next section). Two footnotes keep the grid honest. The tracks column uses ground-truth tracking, so it’s an information ceiling. And on the easy, centered items the zero-shot VLMs still post better global medians (0.147 vs 0.195–0.210): pixel-precision where the camera has already done the work.
The grid settles the question Part 1 left open, one candidate excuse at a time. Is the information missing? No — the tracks column extracts it. Is perception from pixels the wall? No — a small trained CNN gets most of the way there from the same masked frames. What separates the columns of that chart isn’t the input at all; it’s the row: trained versus zero-shot. The frontier models’ general knowledge of the game, in any representation, does not substitute for task-specific inference — which is precisely the question the view from the stands posed in the first place.
The camera lies
Along the way, one statistic explained something that had been bugging me since Part 1: why is naive geometry so useless in broadcast frames? The centroid of the players — “the ball is where the crowd is” — isn’t just uninformative in image space. It’s anti-correlated with the ball (−0.58): when the ball is far from the center of the frame, the player mass tends to be on the opposite side.
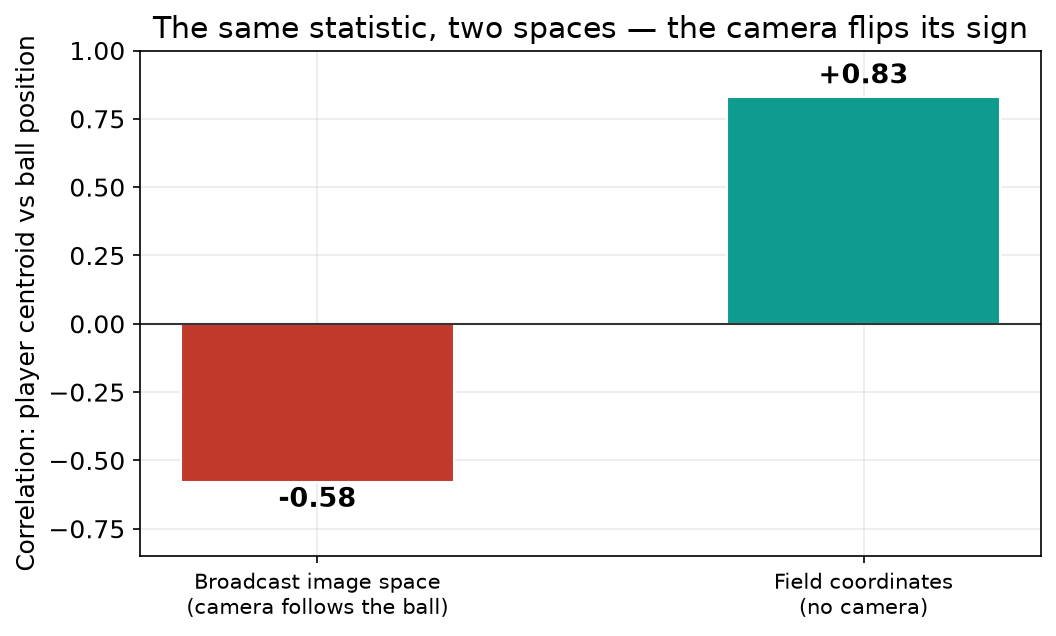
The reason is the camera operator. When a ball is off-center, it’s usually because it’s moving fast — a long pass, a clearance — running ahead of the play while the players trail behind. Project that onto a camera that chases the ball and the geometry inverts. Strip the camera away — compute the same centroid in field coordinates — and the correlation flips to +0.83. Same statistic, same matches; the camera flips its sign. Every system in Part 1 that leaned on “the ball is near the players” was leaning on a lie.
Two sports, one question: what actually transfers?
With a working specialist in hand, I could finally ask the question that motivated this whole project from the stands: how much of this skill is “knowing football”, and how much is universal team-sport structure? I trained the same architecture on soccer (Metrica and SkillCorner tracking data) and on basketball (NBA SportVU), and crossed them.
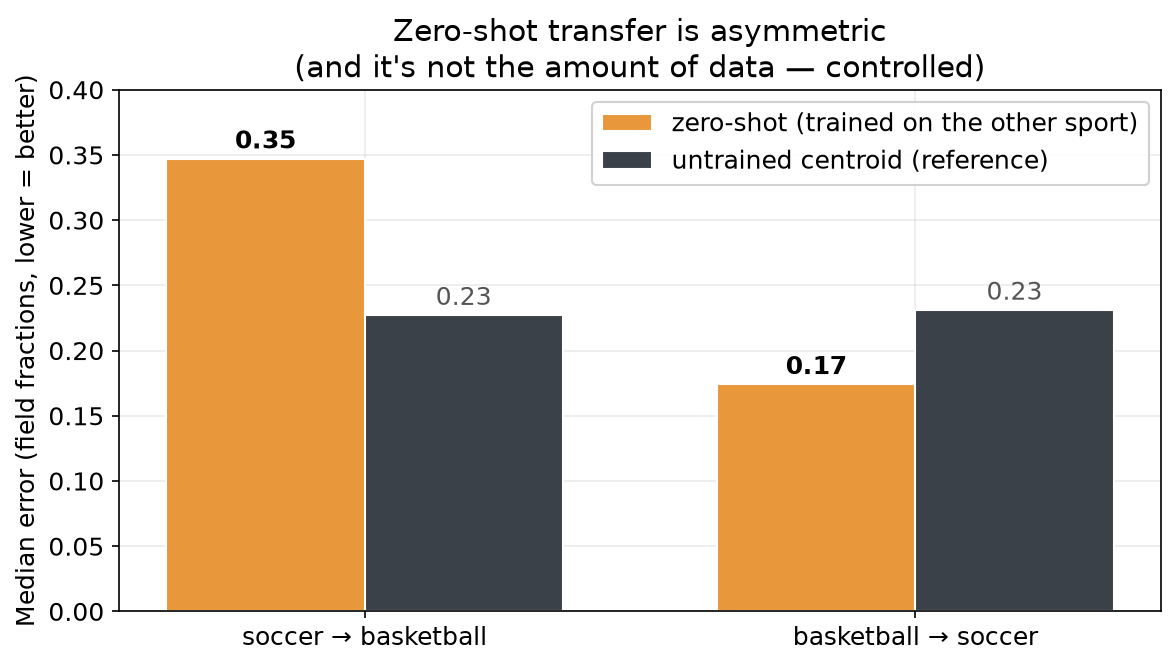
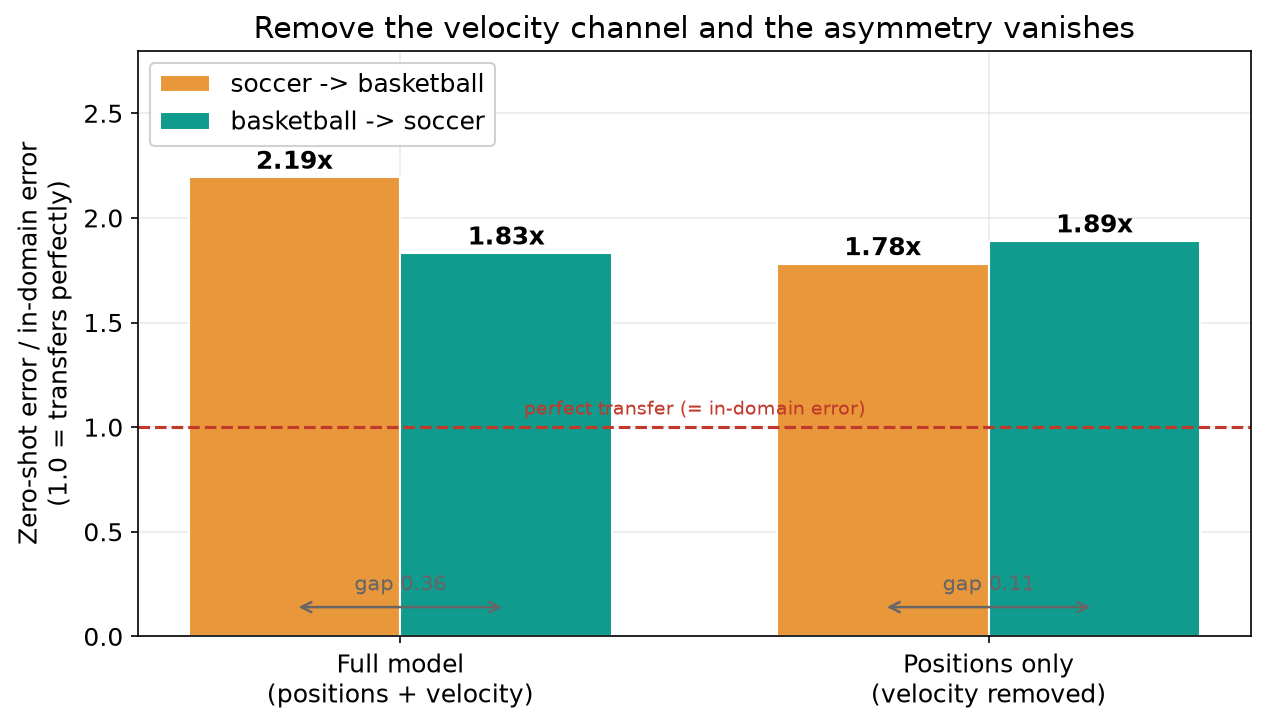
Zero-shot — trained on one sport, tested cold on the other — the result is asymmetric in a way I didn’t predict. Soccer→basketball fails: worse than an untrained centroid. But basketball→soccer works: 0.17 median error, beating soccer’s own geometric baselines without ever seeing a football match. And no, it’s not that the basketball dataset is bigger — subsampling it to match the soccer data leaves the result intact (0.174).
It took a couple of wrong turns to pin down. My first guess — that basketball’s ball simply lives closer to the player mass — measured false: the ball-to-mass distance distributions are nearly identical. The real culprit is velocity scale. Strip each player down to positions only, discarding the velocity channel, and the absolute gap roughly halves (+0.162 → +0.091 median error); measured against each sport’s own in-domain error, it vanishes — positions transfer about symmetrically both ways; it’s the use of velocity that only travels one direction (one seed per variant, so take the exact figures loosely). The reason is a units mismatch I should have seen coming: a basketball court (28×15 m) is about a quarter the length and width of a football pitch (105×68 m), so in the normalized coordinates the model reads, players move three to four times faster in basketball. A model’s learned sense of “how fast is fast, and what that implies about where the ball is” is calibrated to its own sport’s scale and misfires across a 3–4× gap. Positions carry no such scale, so they cross cleanly. Once each sport’s baseline difficulty is discounted, that is the whole asymmetry — and a small, general lesson: what transfers between domains is the scale-free structure; anything with units attached needs recalibration.
Fine-tuning, and a hypothesis that died twice
Does pretraining on one sport at least give you a head start on another? Here I got burned by my own enthusiasm — twice — and both times a control caught it.
First pass: with instantaneous player features, pretraining on soccer gave no advantage over training from scratch on the same basketball minutes. Second pass: with one-second trajectories it did — and I nearly wrote “temporal dynamics is what transfers.” Then a shuffled-target control (pretrain the same net on soccer inputs with randomized ball positions — same optimization warm-up, zero knowledge) showed a third of that advantage was generic warm-start. And a feature ablation showed the rest wasn’t about temporal depth at all: the advantage tracks whichever variants use velocity features, snapshot or trajectory alike.
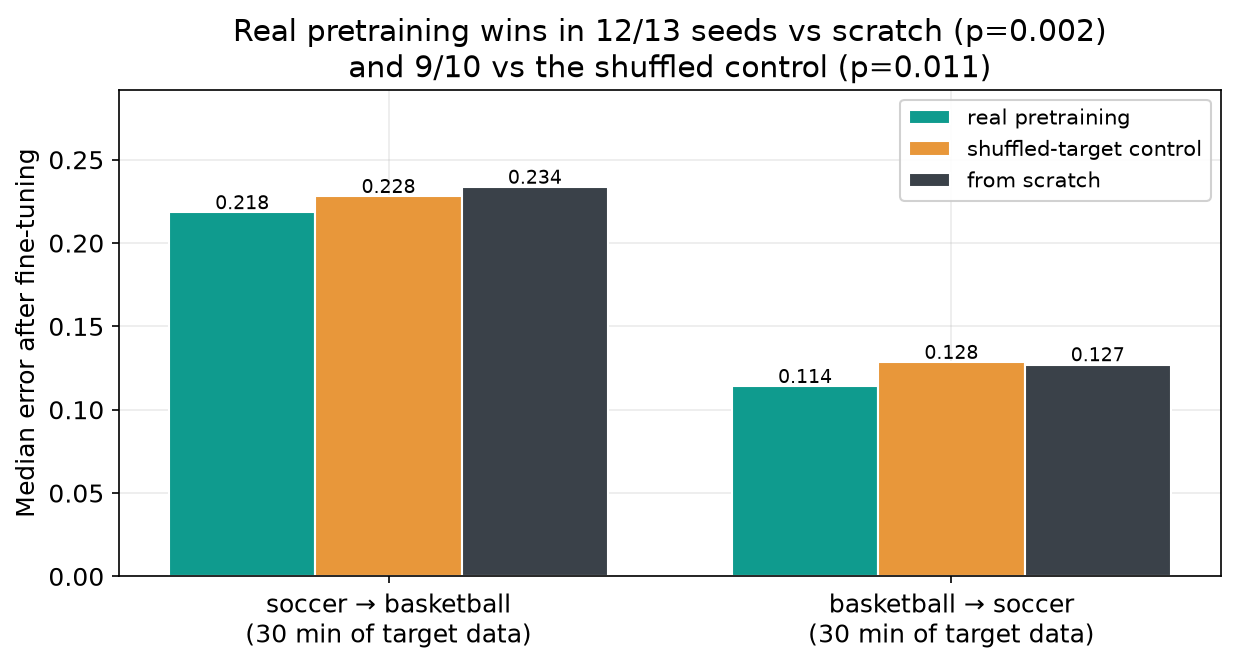
What survives all the controls, pooled across both transfer directions: real pretraining wins in 12/13 seeds against scratch (p=0.002) and 9/10 against the shuffled control (p=0.011), with a modest ~5% edge that only shows up once you have ~30 minutes of the target sport. The refined picture: positions carry the core signal, but their mapping is easy — half an hour of any sport teaches it from zero. What genuinely transfers is the harder-won skill of exploiting velocities, which misleads zero-shot (speed scales are sport-specific) but pays off once briefly recalibrated.
“Knowing the game,” for this family of models, turns out to mean something narrow and specific: knowing what to do with motion.
Takeaways
- Training matters; the input barely does. A 60 kB net on tracks (82%) and a small CNN on masked pixels (74%) both crack the off-center balls; the zero-shot frontier models fail from both inputs — 53% on pixels, 35–38% (below chance) on the very same tracks as text. Neither information nor perception is the wall: general game knowledge doesn’t substitute for task-specific inference.
- Broadcast geometry is a trap. The player centroid is anti-correlated with the ball in image space (−0.58) and strongly correlated in field coordinates (+0.83). The camera flips the sign.
- Transfer between sports is asymmetric, and the asymmetry is a velocity-scale mismatch. Basketball exports its ball-sense to football; football doesn’t return the favor. Positions transfer about symmetrically both ways once each sport’s own error is discounted — it’s the use of velocity that breaks, because the two sports live 3–4× apart on the normalized velocity scale. The scale-free structure crosses; the units-bound part doesn’t.
- The controls did the heavy lifting, again. A shuffled-target pretraining control and a feature ablation each overturned a conclusion I was ready to publish. This project is three-for-three on “the first version of the story was wrong.”
Next up is Level 3 of this ladder: the geometry and topology underneath — when do the players determine the ball, and can interpretable structure (Voronoi cells, pitch control, persistent homology) recover what the little black box learned?
Code, data pipelines, controls, and audits in the wheres-the-ball repo. Player tracking from SoccerNet-Tracking, Metrica Sports, SkillCorner, and the NBA SportVU 2015-16 logs (mirror; no explicit license — used for research only, not redistributed). Architecture: DeepSets.