Where's the Ball? Part 3 — It Was Geometry All Along (and the Model Doesn't Know When It's Wrong)
In this article
Part 2 ended with a small network — about 60 kilobytes of weights — cracking the hidden-ball cases that frontier vision-language models couldn’t. It read the players’ positions and velocities and pointed, with decent accuracy, at a ball it had never been shown.
Which is satisfying and slightly annoying, because a network that works is still a black box. It gives you an answer, not an explanation. So the question that opens the last rung of this ladder is: what is that little box actually computing? Is there some rich, deep pattern in how ten players arrange themselves — or is it doing something a human could write down on the back of an envelope?
I spent Level 3 trying to open the box three ways. The short version: it’s mostly a single geometric idea, the fancy mathematics I reached for added nothing, and when I asked the model how sure it was, it turned out to be confidently wrong in a very specific place.
It was geometry all along
The test is simple. If the black box is computing something interpretable, then a handful of hand-written geometric features — quantities a coach could name — fed to a plain gradient-boosted tree should reproduce most of its accuracy. If it’s doing something genuinely deep, they won’t come close.
I wrote about ten: the centroid of the players, the centroid weighted by how fast each player is moving, the fastest player’s position, the densest cluster, the spread of each team, the midpoint of the closest pair of opponents, a “convergence point” where the players’ motion rays intersect. Ten numbers, a tree, the same train/test split as the deep model.
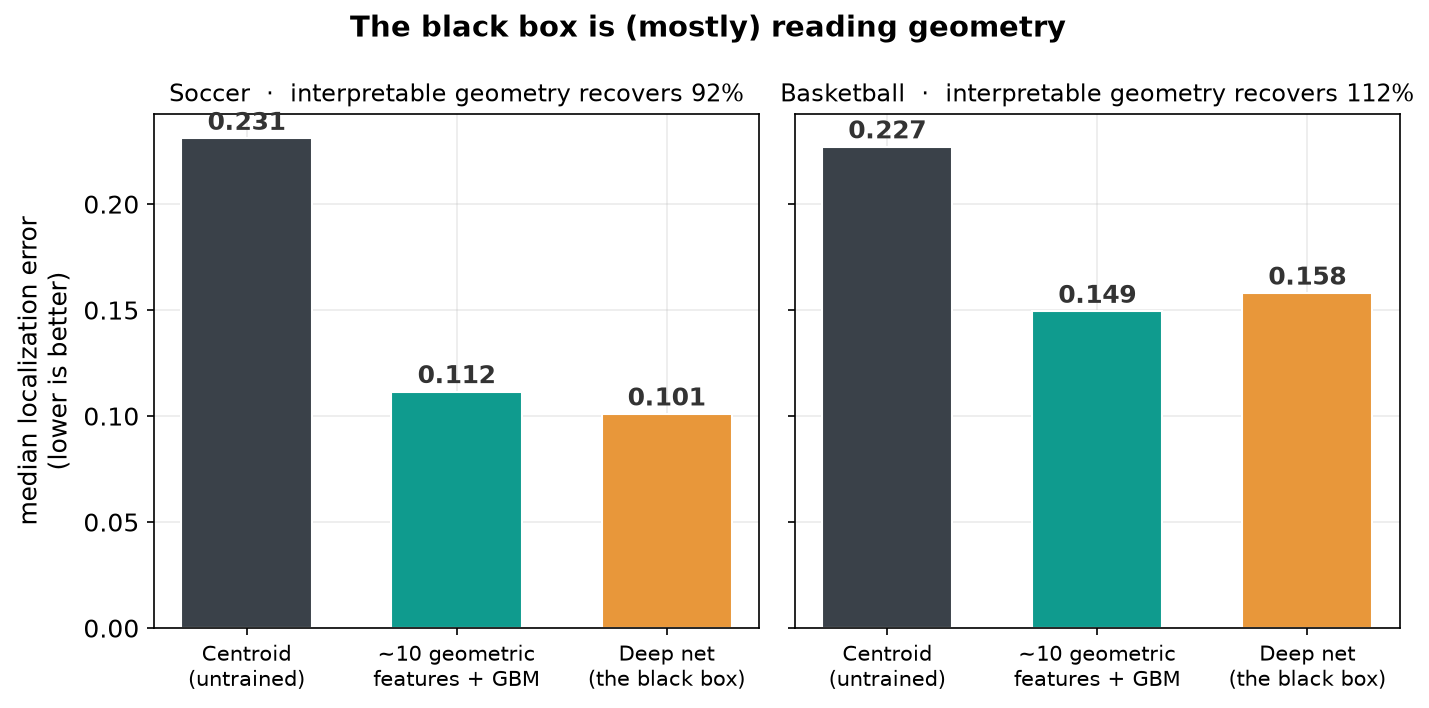
The gap between a naive centroid baseline and the trained deep net is the “skill” the network learned. Ten interpretable features recover 92% of that gap in soccer — and in basketball they slightly beat the deep net (112%). The little black box, it turns out, is not hiding much. Almost everything it knows can be written down.
One number does most of the work
And most of that is a single feature. When I measure how much each geometric quantity contributes — by shuffling it and watching the error rise — one dominates the rest by an order of magnitude:
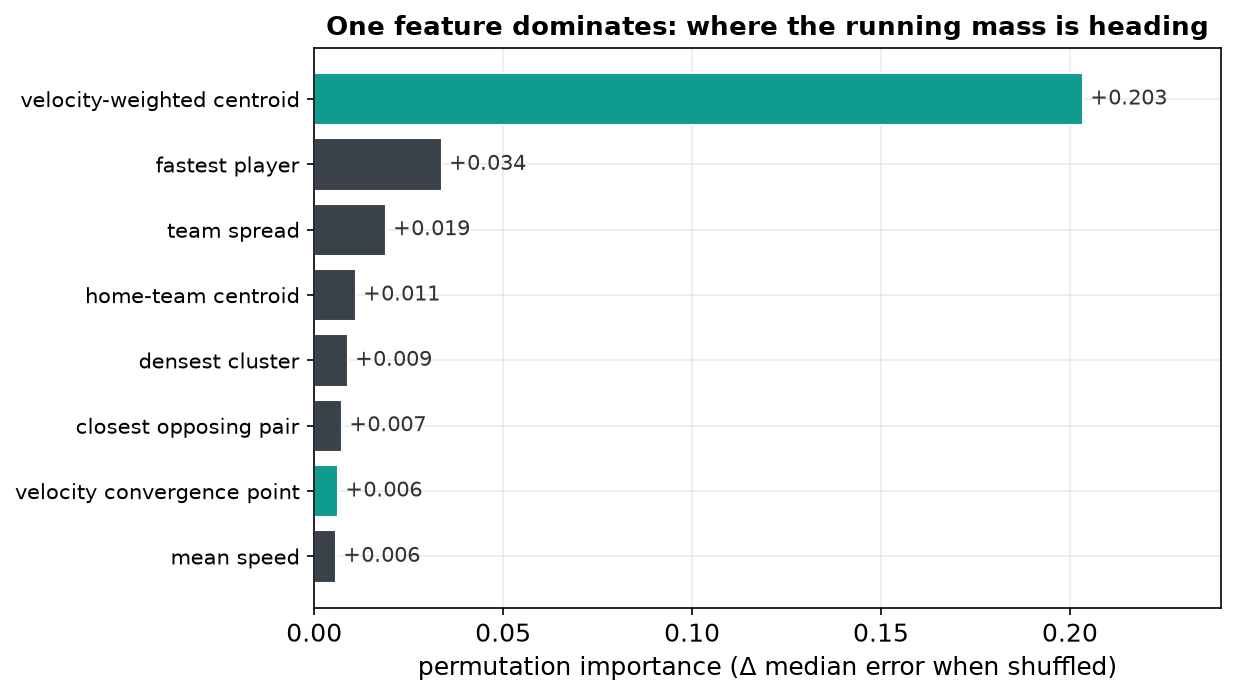
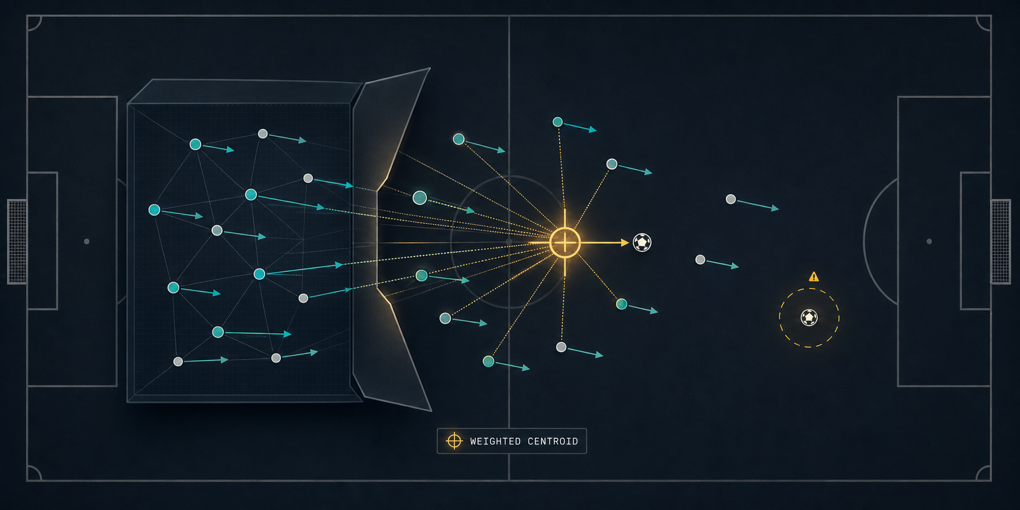
The velocity-weighted centroid — the average player position, but with the fast-moving players counting more — carries the localization on its own. Everything else is rounding. This is the same thread that ran through Part 2: the signal is in the motion, in where the running mass is heading, not in the static shape of the formation.
There’s a small irony here. The feature I was proudest of — the “convergence point”, a tidy least-squares intersection of every player’s motion ray, the thing you’d draw on a tactics board to say the ball is where everyone is running — barely moves the needle. The crude weighted average of positions beats the elegant geometric construction. Not the last time this project would humble a nice idea.
What I hoped topology would add (and didn’t)
If ten simple features already recover almost everything, is there any structure left that a richer description could capture? The natural candidate is topology — the shape of the player cloud, its holes and connected components, formalized as persistent homology. There’s a genuinely appealing intuition behind it: a ball in open play often sits inside a hole in the configuration — a ring of players around empty space — and topology is exactly the mathematics of holes.
So I built the topological features: the persistence statistics of the player cloud, the centre of its most persistent loop (via the representative cycle — literally “where’s the biggest hole”), the two largest empty circles in the Delaunay triangulation (“where’s the biggest gap”). I set one rule before running anything, to keep myself honest: topology only counts if it beats its geometric counterpart. Otherwise it’s decoration.
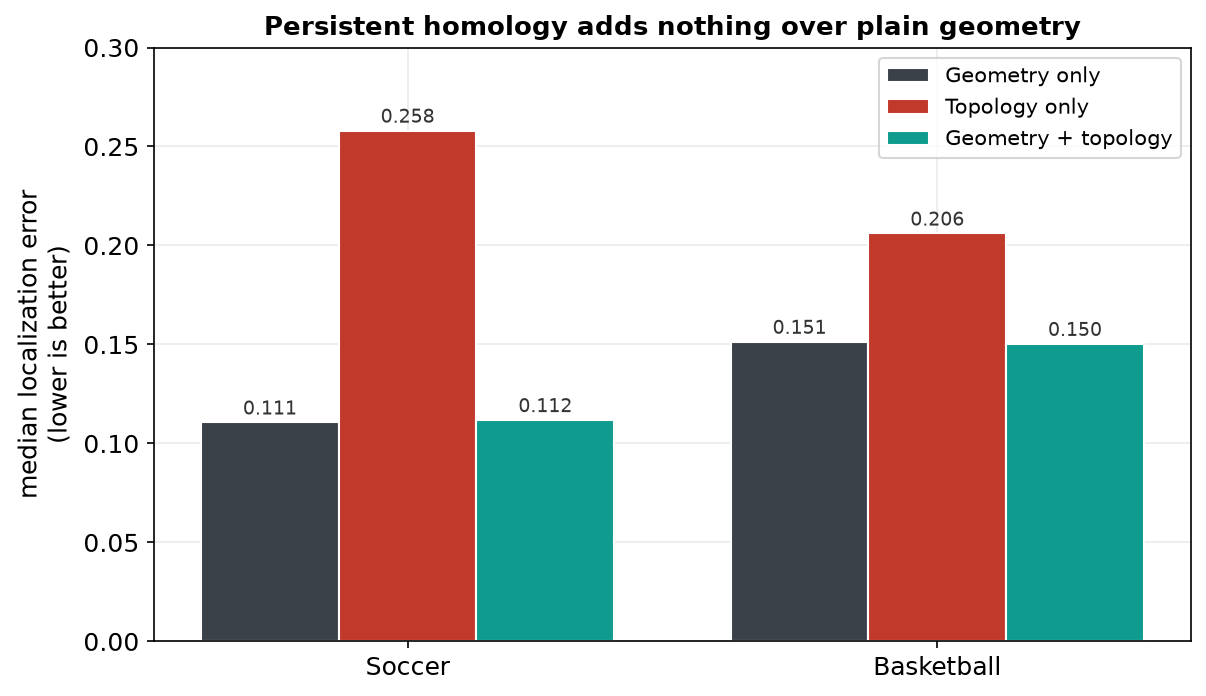
It doesn’t clear the bar. Topological features on their own land far behind plain geometry (0.258 vs 0.111 in soccer — barely better than the naive baseline). And bolting them onto the geometric features changes nothing: geometry-plus-topology matches geometry alone, and when I shuffle the entire topological block the error barely twitches — the tree simply ignores it once it has the geometry.
The appealing intuition is just wrong. The ball’s position isn’t a property of the shape of the player cloud; it’s a property of where the mass is and where it’s moving. Persistent homology describes the configuration beautifully at every scale, and none of that description is about the ball. A clean negative result — and the pre-registered rule is the only reason I can call it clean instead of quietly dropping it.
Does the model know when it’s wrong?
The last question is the one I find most interesting, because it’s not about accuracy — it’s about self-knowledge. A point prediction can’t tell you how sure it is. So I swapped the network’s single-point output for a mixture density head: instead of one guess, it predicts a full probability distribution over where the ball might be. Now it can say “somewhere around here, and I’m confident” or “somewhere in this whole region, and I’m not.”
The first finding is reassuring. The uncertainty it declares does track the error it makes — bin the predictions from most-confident to least, and the actual error climbs monotonically:
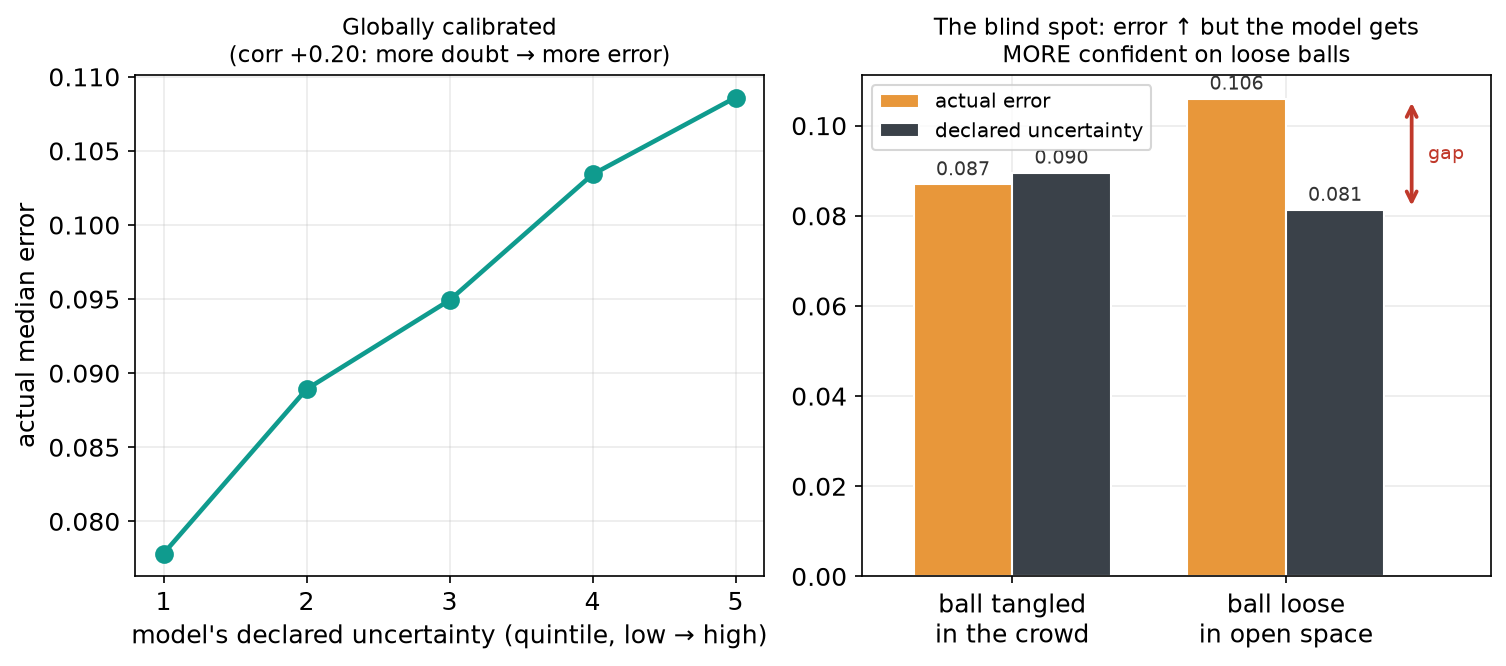
That’s the left panel: the model knows when it doesn’t know. Weakly (the correlation is a modest +0.20), but consistently.
The right panel is where it gets interesting — and where my hypothesis died, again. I’d expected the ball to be hardest to pin down when it’s tangled in a crowd of players, and easiest when it’s loose in open space. It’s the opposite. Tangled play is the easy case: when players converge on the ball, their velocities point at it, and that velocity-weighted centroid lands right on top. A loose ball, with players trailing behind it, is genuinely harder — about 20% more error.
Here’s the blind spot: on those harder loose balls, the model declares lower uncertainty. Its error goes up while its confidence goes up. It is most sure of itself exactly where it is most wrong — and these are the same off-centre, fast-moving balls that the frontier models failed on back in Part 1. The failure mode is consistent all the way down the ladder: everything struggles with the loose ball, and the specialist doesn’t even know it’s struggling.
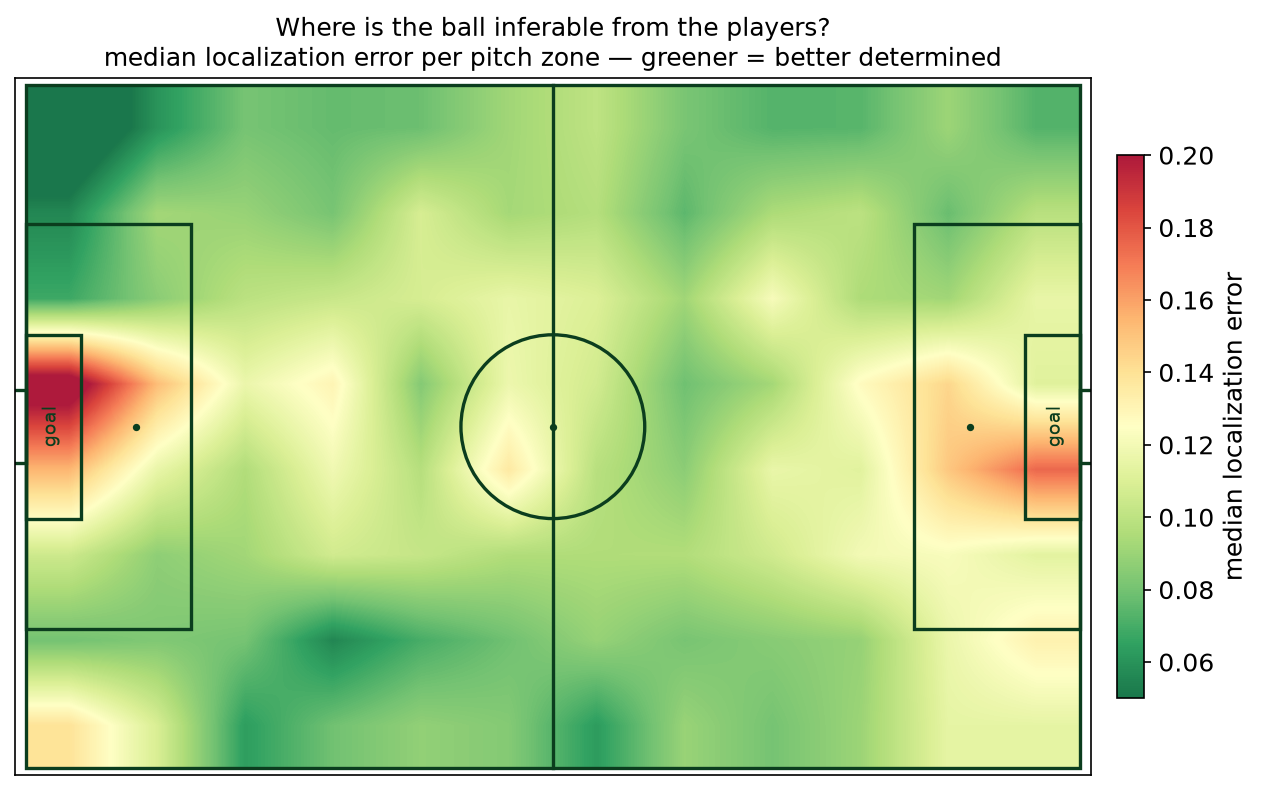
Where does that leave the map of the pitch? If you plot the median error across the field, the ball is best determined near the touchlines and in open midfield, and worst in the congestion in front of both goals — the corners, crosses, and goalmouth scrambles where players pile up and the convergence trick breaks down.
Takeaways
- The black box was reading geometry. Ten interpretable features recover 92% of the deep net in soccer and beat it in basketball. Ball localization isn’t a deep pattern — it’s mostly one number: the velocity-weighted centroid, “where the running mass is heading.”
- Topology added nothing. Persistent homology, largest empty circles, loop centres — the appealing “ball sits in the hole” intuition — don’t beat plain geometry and get ignored when added to it. The ball’s position isn’t a property of the configuration’s shape. A pre-registered rule kept the negative result honest.
- The model is confidently wrong in one place. It’s globally calibrated, but overconfident on loose balls in open space — precisely the hard, off-centre cases that broke the frontier models in Part 1. It doesn’t know that it doesn’t know, exactly where it matters.
- My best guesses kept losing to the plain ones. The elegant convergence point lost to a weighted average; topology lost to ten simple features; the “crowds are confusing” hypothesis was backwards. Across three parts, this project went a perfect four-for-four on “the first version of the story was wrong” — which is the whole reason I write the controls before I write the conclusion.
Three rungs in, the answer to the question from the stands is almost anticlimactic. Inferring a hidden ball from the players is real, it’s learnable, and it’s geometry — a coach’s instinct for where the play is heading, written as one weighted average. The frontier models have that instinct faintly and can’t act on it; a 60 kB network has it sharply. And neither of them, it turns out, can tell you when the ball has slipped loose into space and they’ve quietly lost the thread.
Code, feature definitions, controls, and the topology and mixture-density experiments in the wheres-the-ball repo. Soccer tracking from Metrica Sports and SkillCorner; basketball from the NBA SportVU 2015-16 logs (mirror; no explicit license — used for research only, not redistributed). Persistent homology via ripser. Previously: Part 1 and Part 2.